


FlipSite is a resale inventory tracker I built because my spreadsheet started lying to me. Entering data is the easy part — keeping it connected to receipts, photos, and cost splits across months of history is where spreadsheets quietly fall apart.
The bundle math problem
The thing I cared most about was handling items that don’t map cleanly to a single transaction. If I buy a camera kit for one price and sell the body, lens, and accessories separately, each piece needs its own sale state while still sharing the original purchase cost. A spreadsheet can fake this until one edit corrupts three months of history.
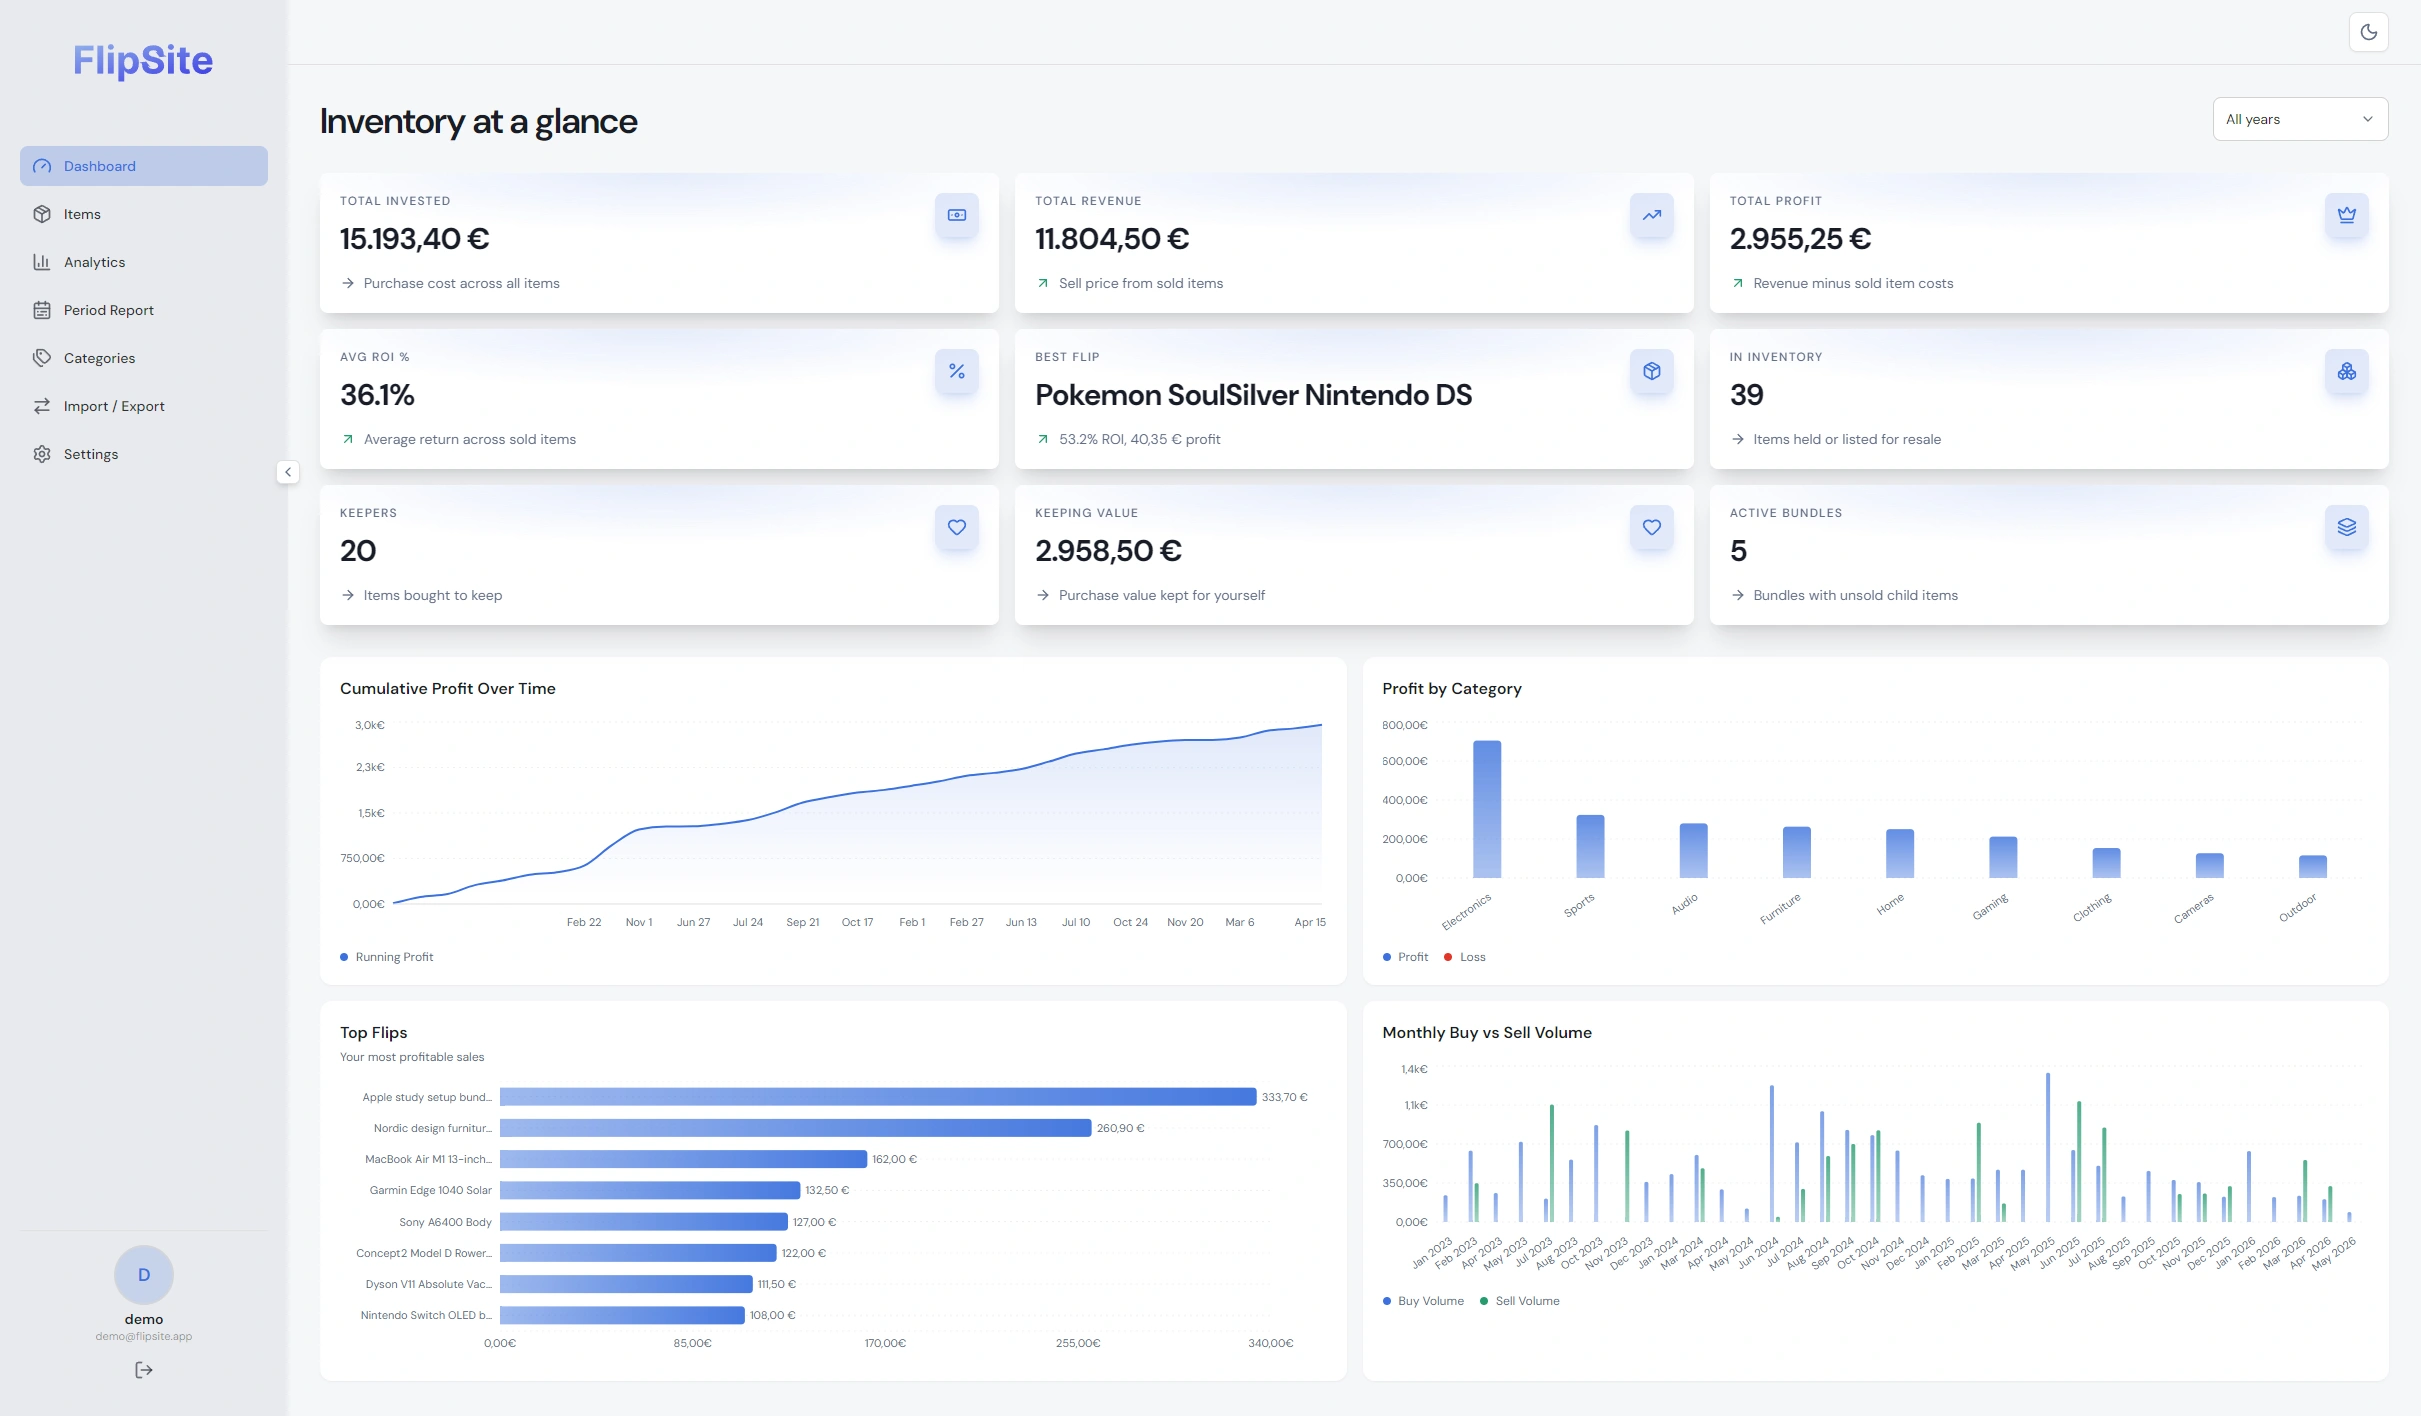
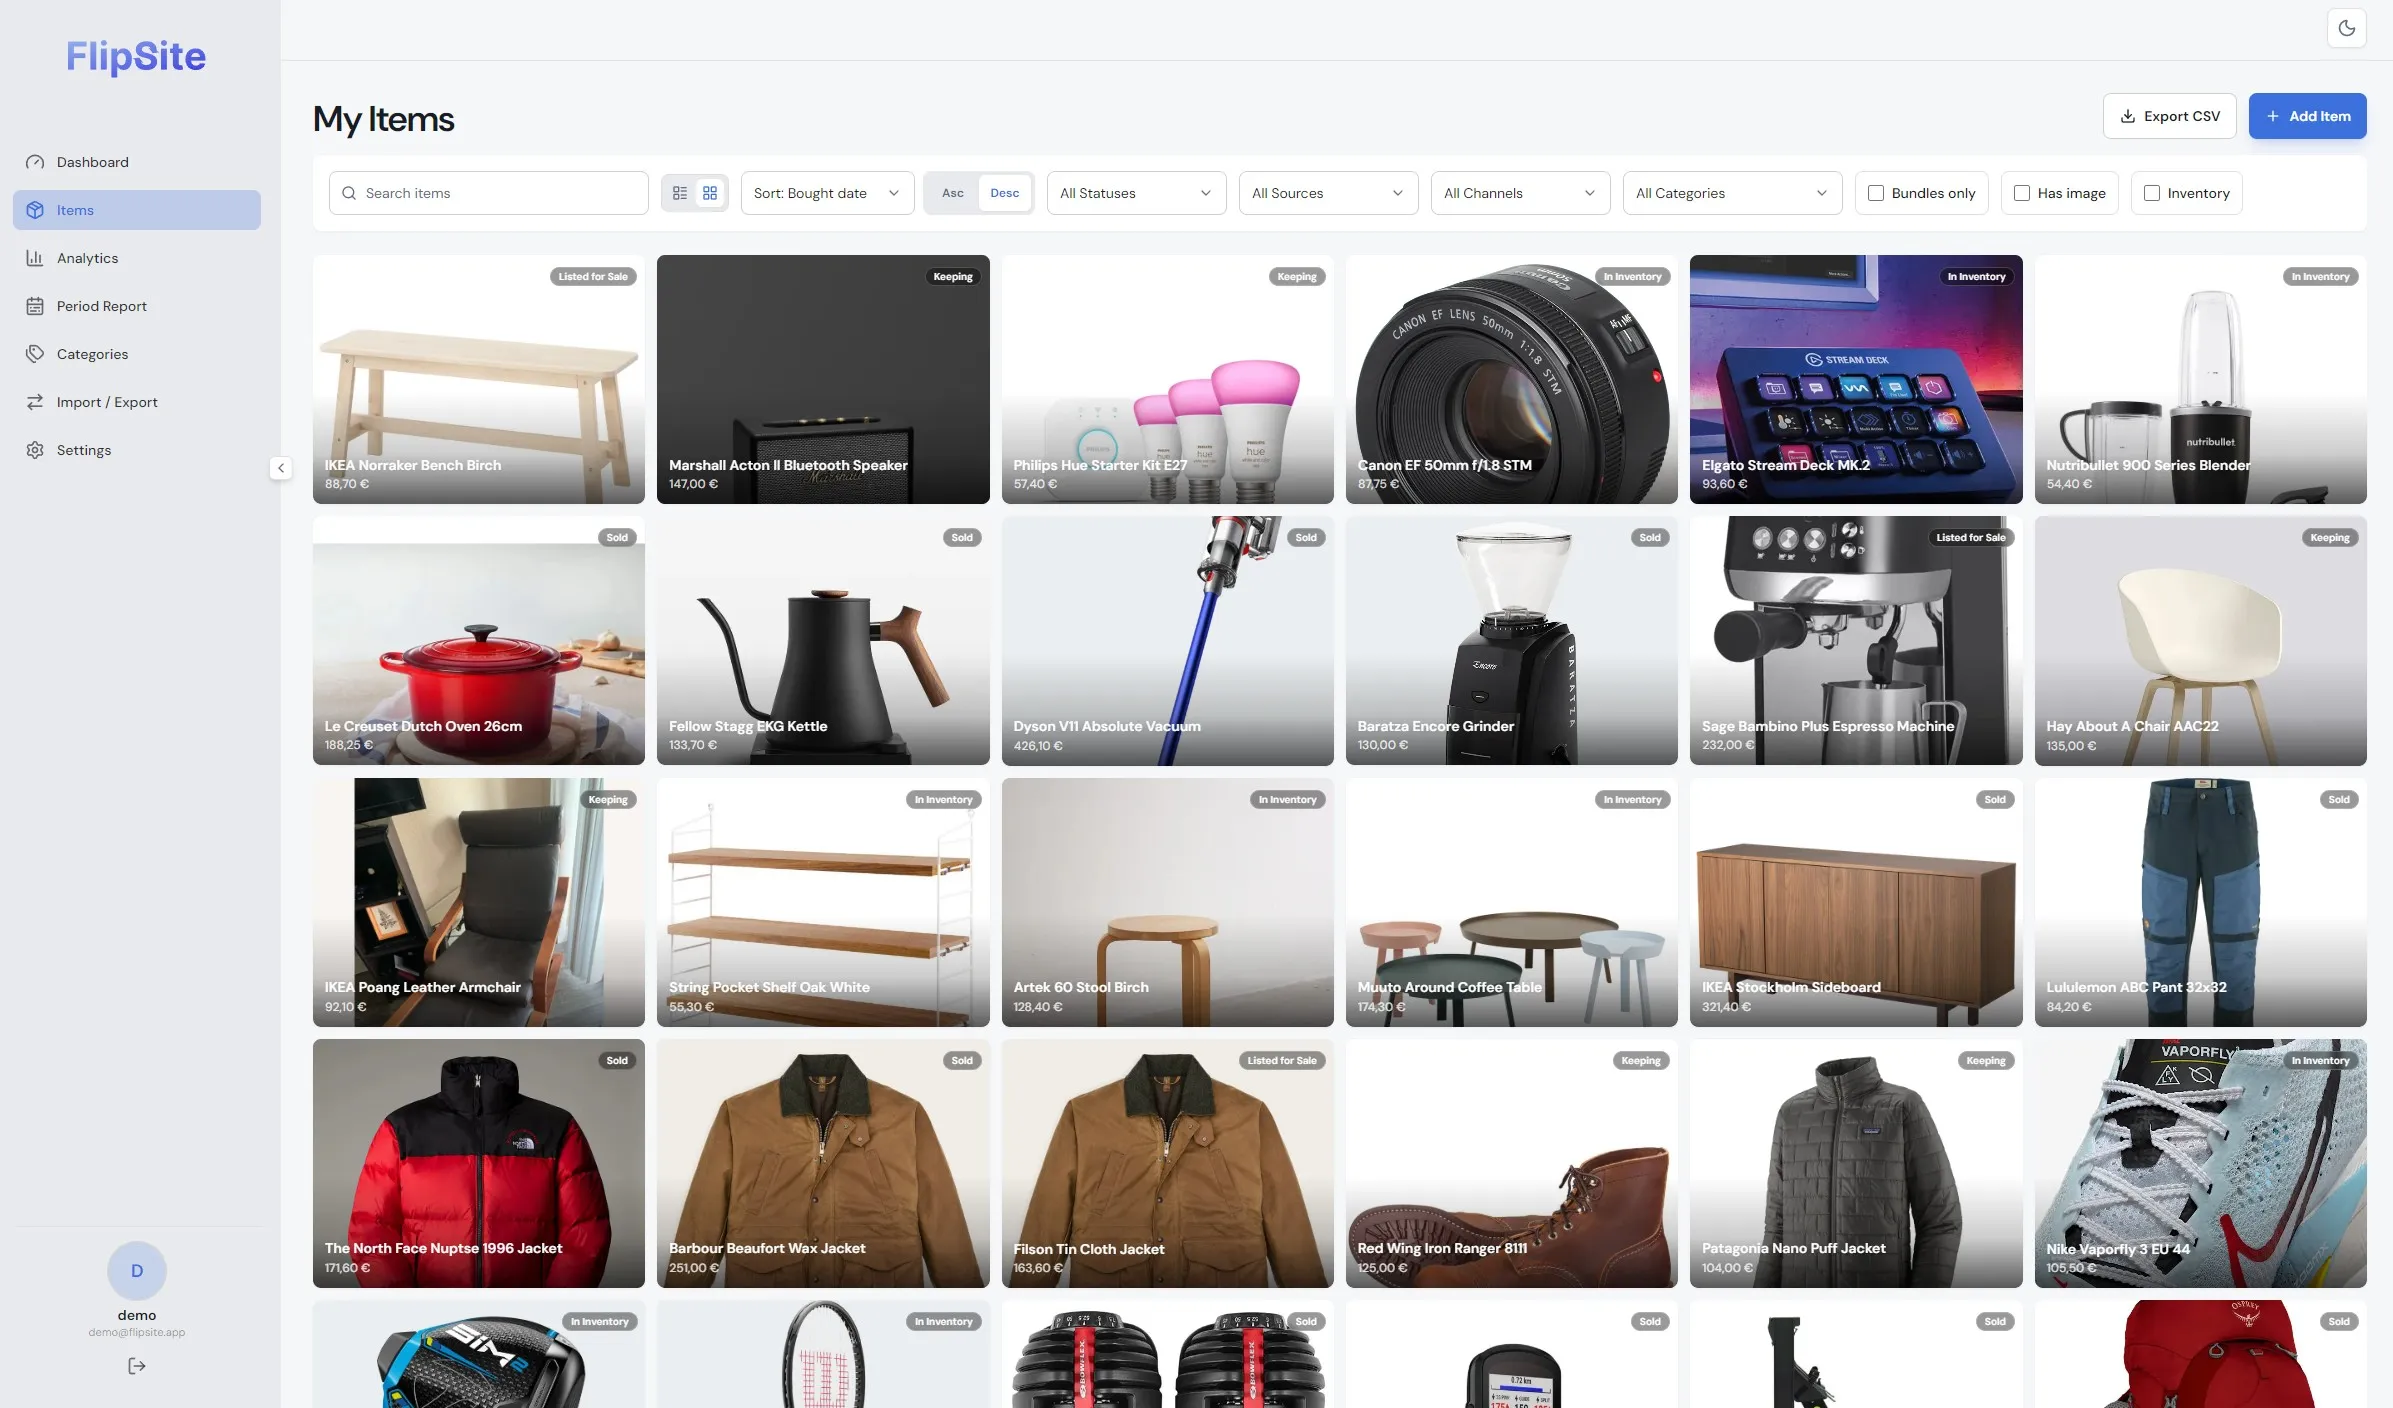
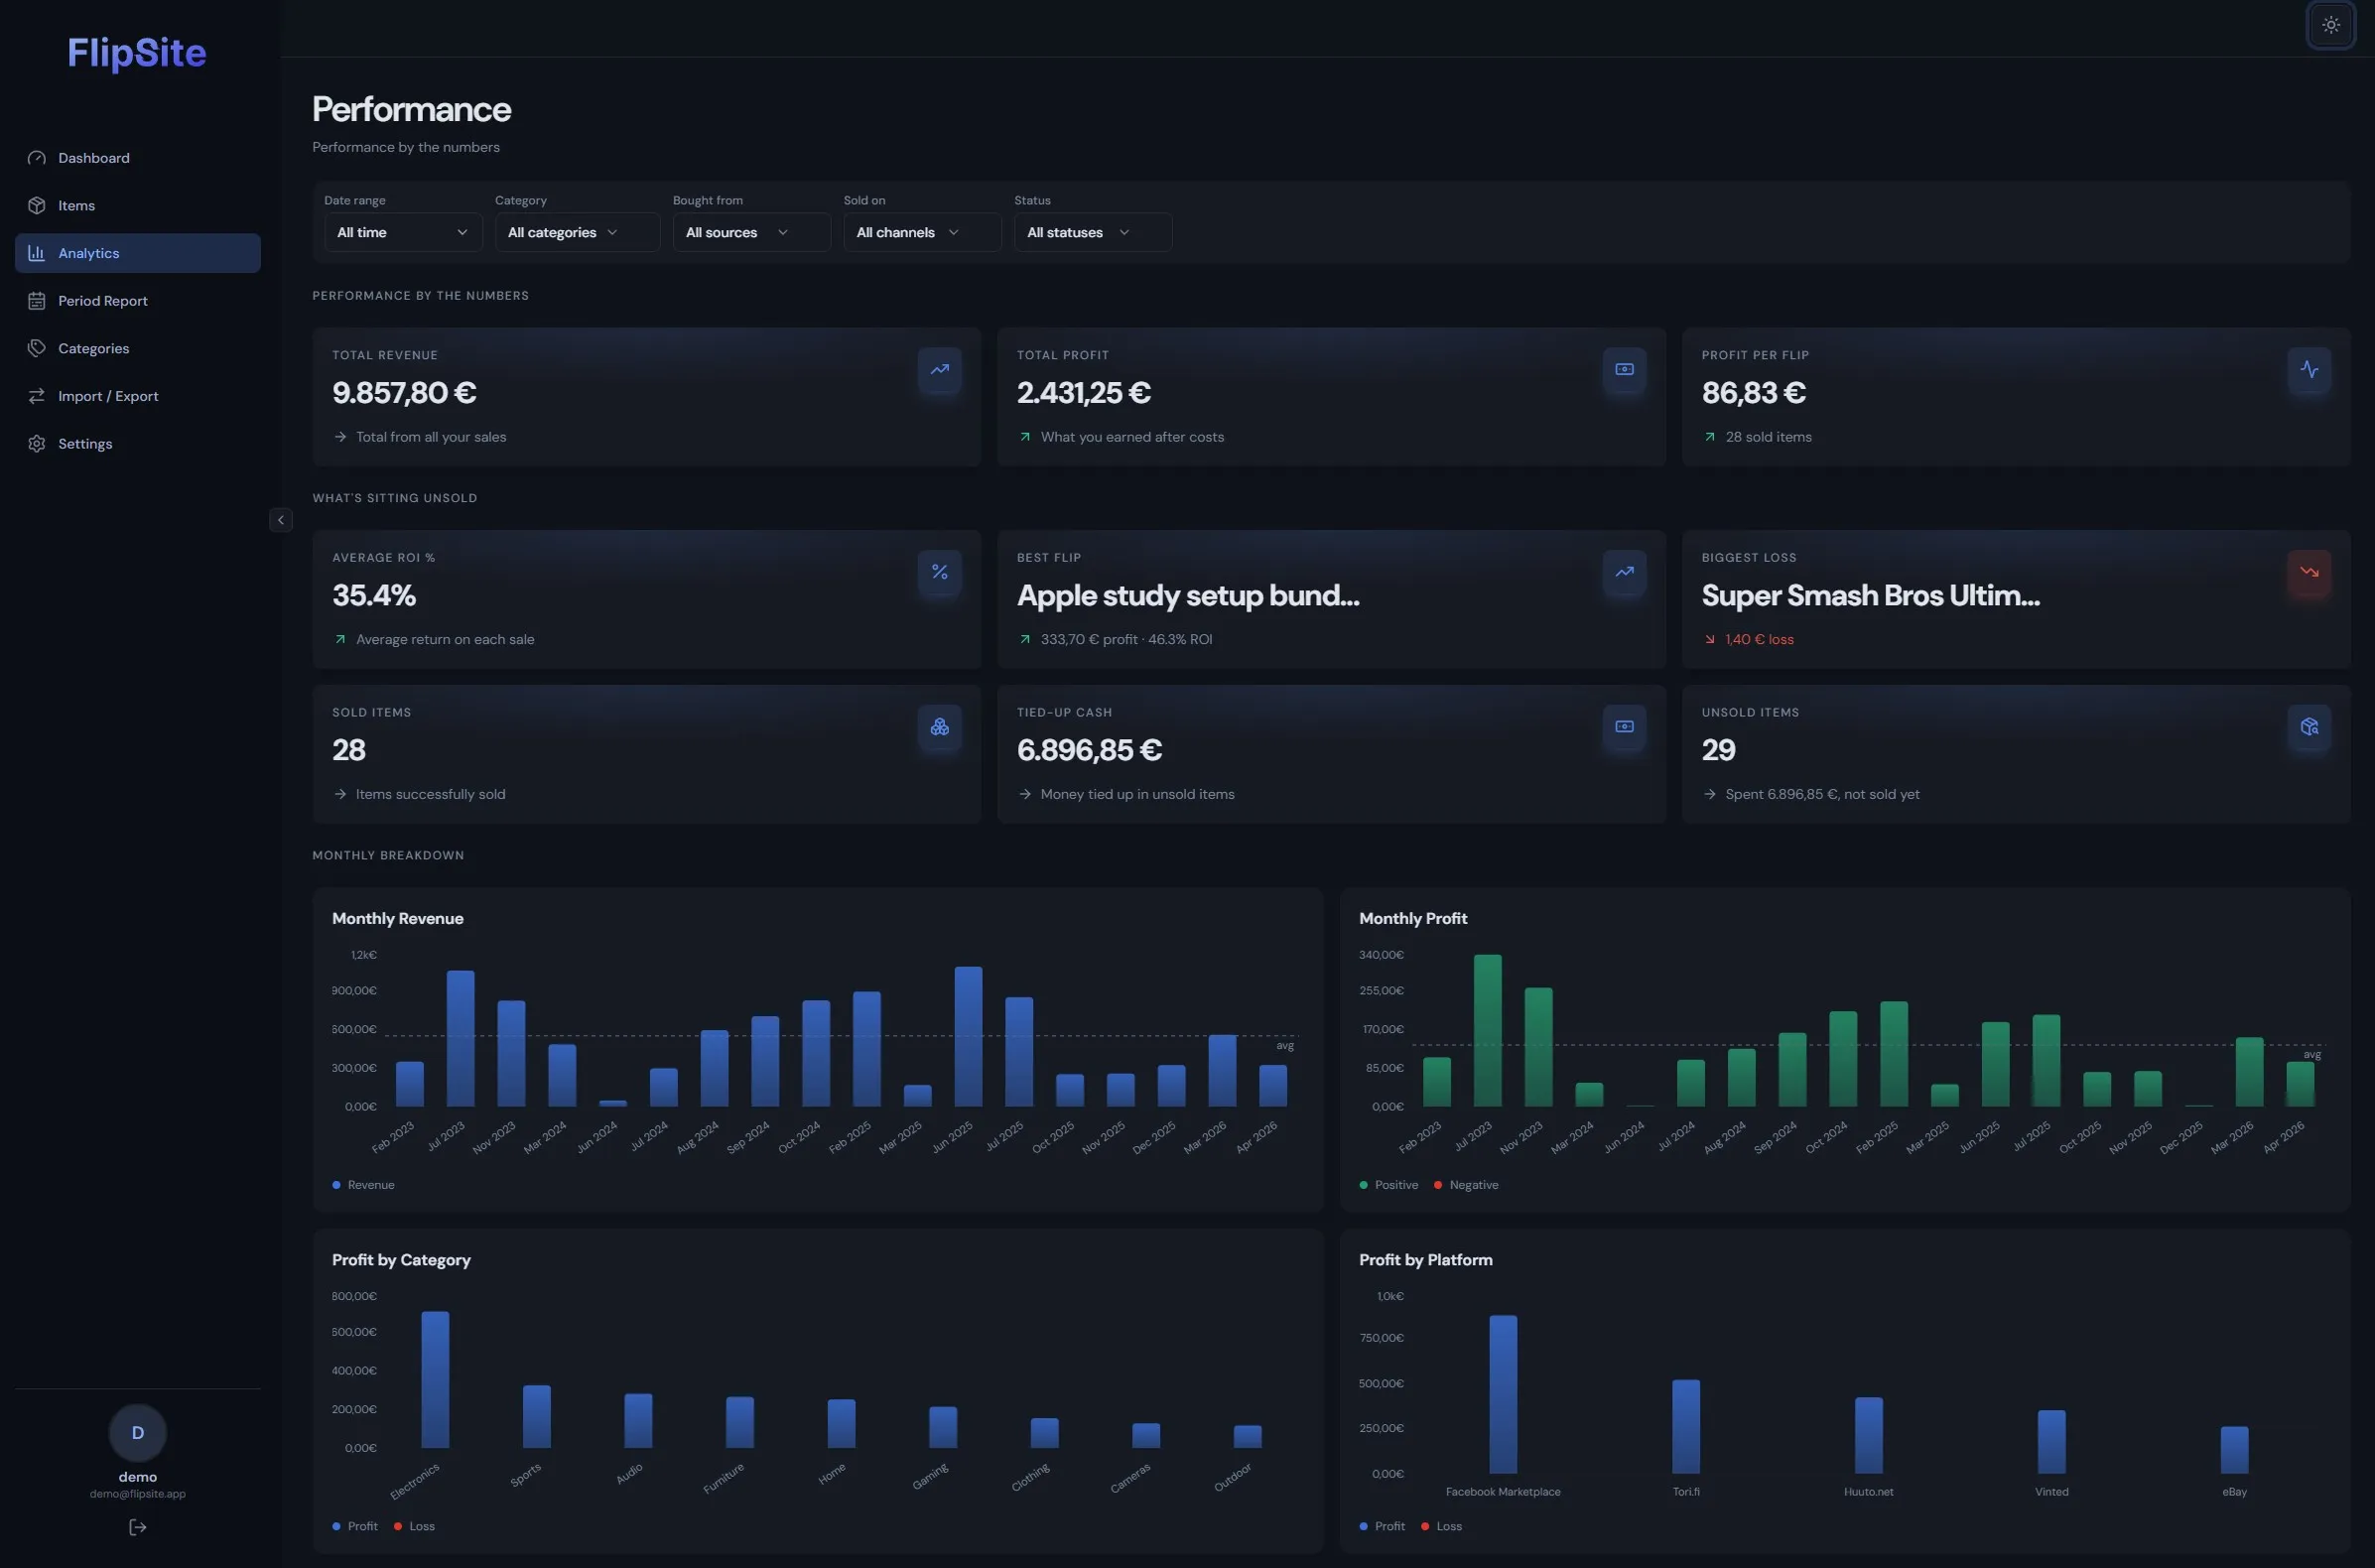
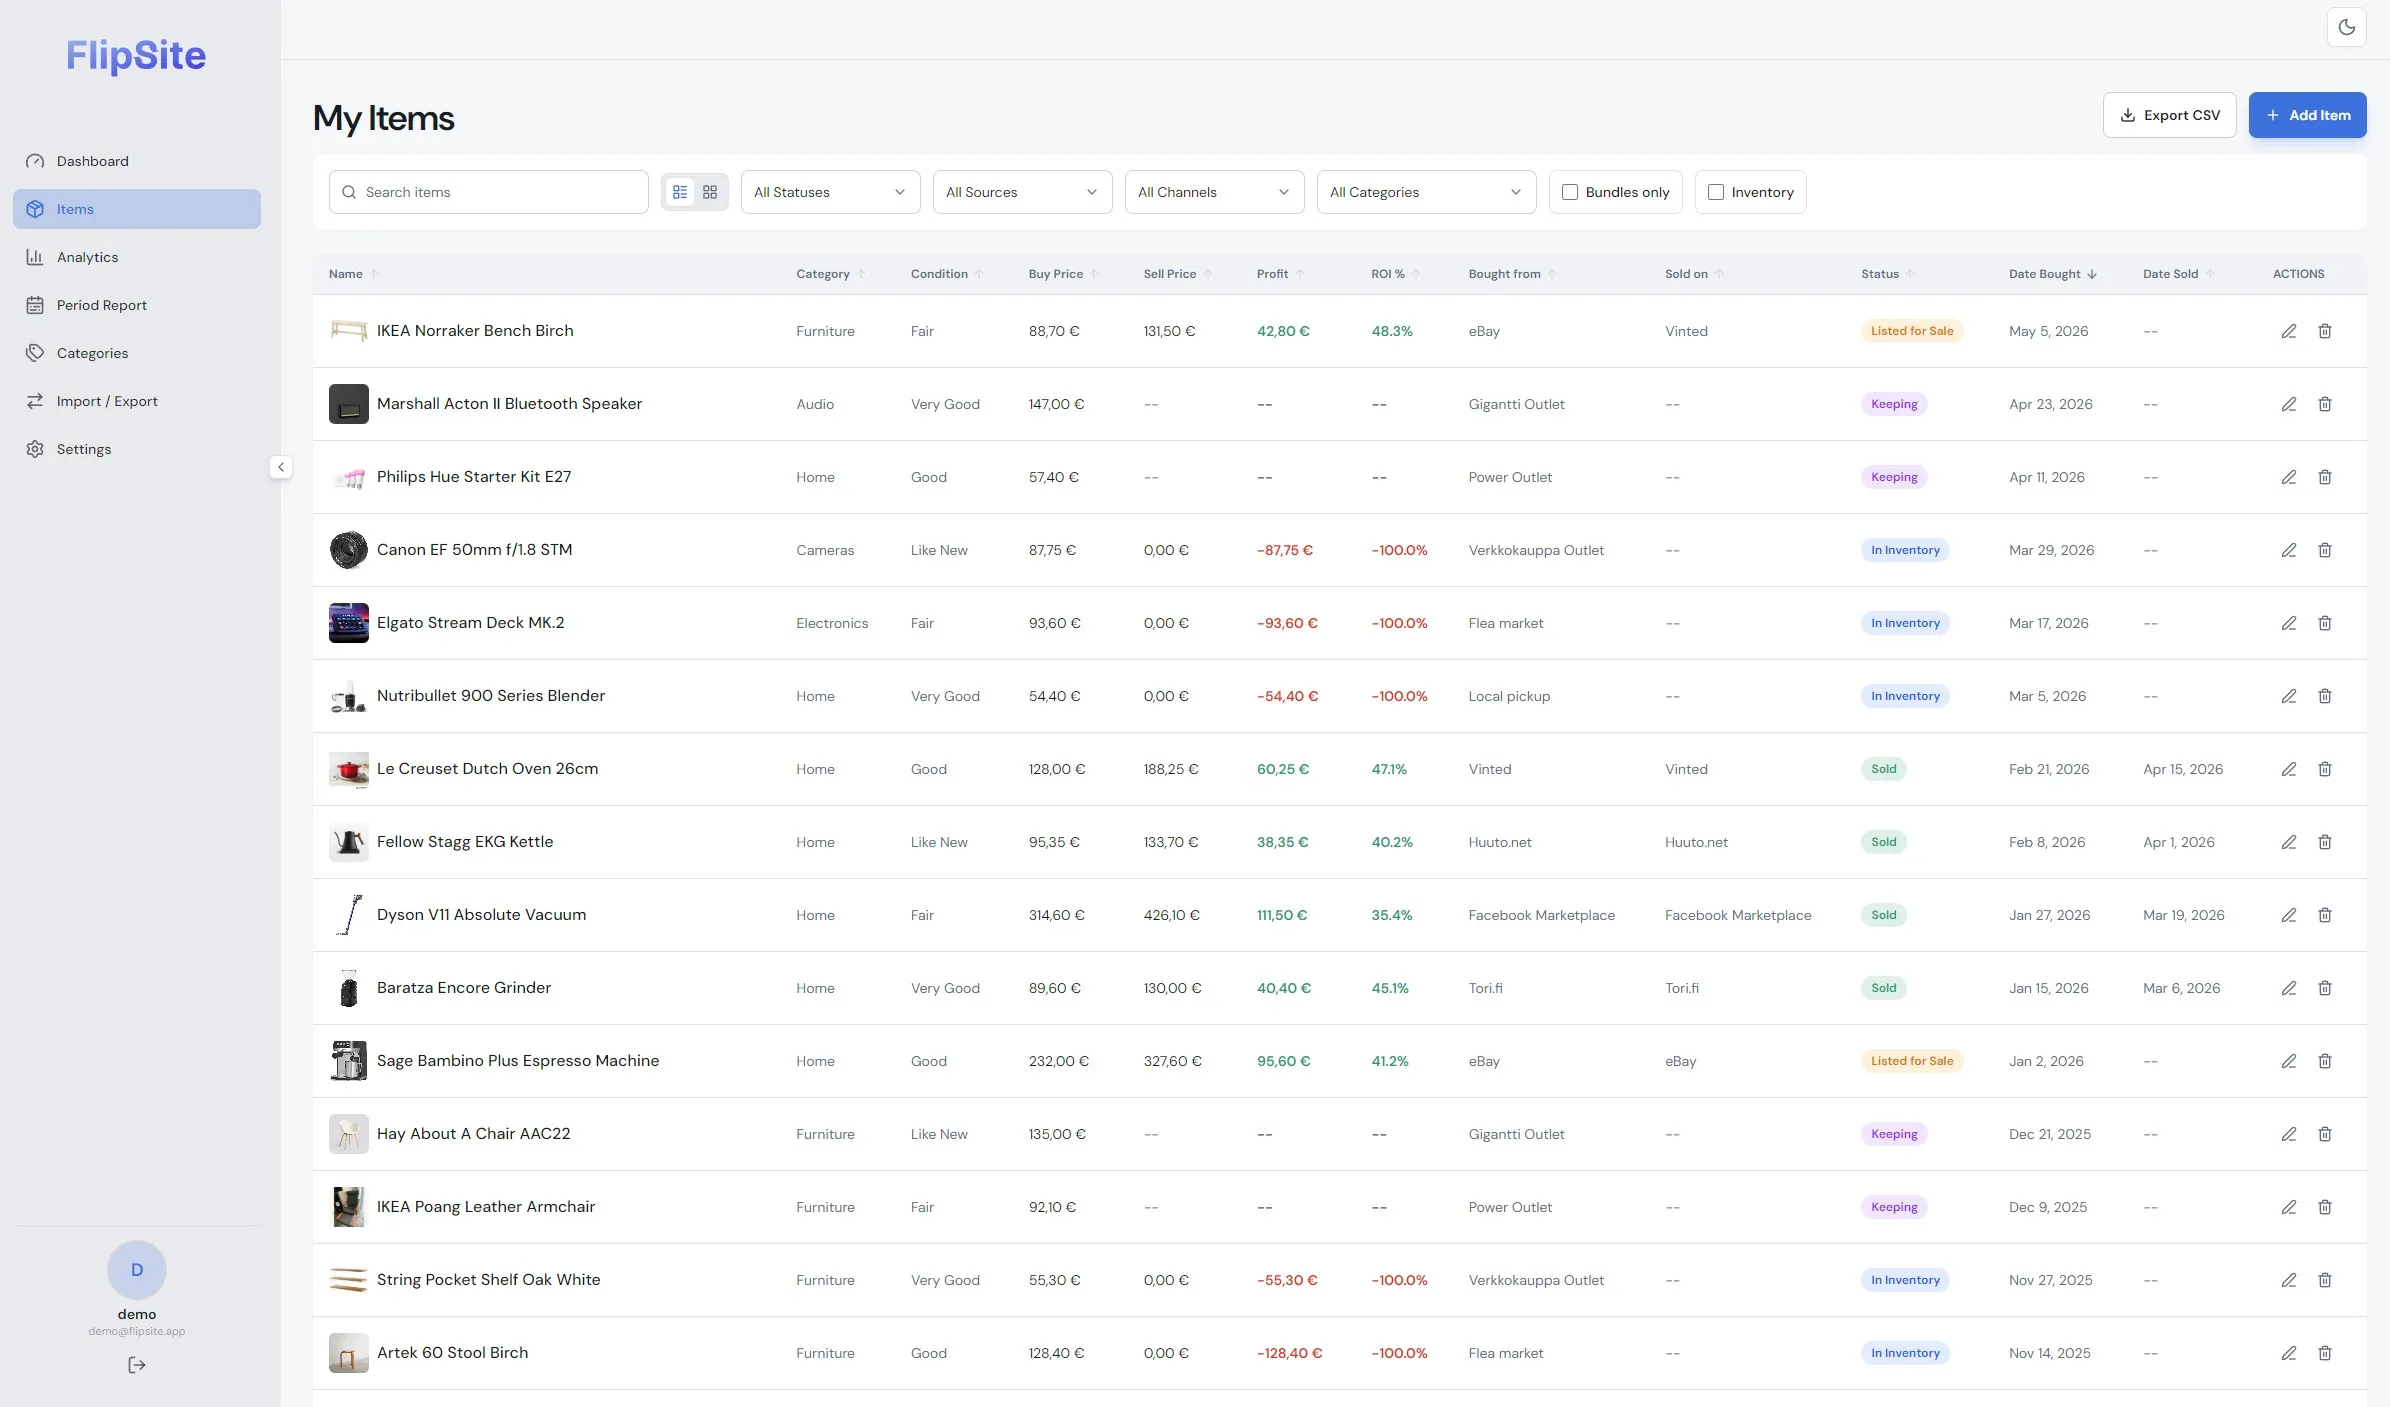
Beyond that, the core actions are what you’d expect: add items with photos, prices, platform, and condition; attach receipts; mark things as holding, listed, sold, or keeping; and review profit, ROI, and hold time against a rough pace line.
Under the hood
Supabase handles auth, Postgres, file storage, and row-level security. TanStack Query keeps data loading predictable, and Recharts powers the analytics views.
Stack
The frontend is React, TypeScript, Vite, and Tailwind CSS, with Supabase behind the data layer. UI components use Radix-style primitives, lucide-react, sonner, and some GSAP on the landing page.
Where it stands
FlipSite replaced my spreadsheet, which is the only success metric that matters here. If I rebuilt it I’d move some analytics closer to the database and tighten import/export earlier, but I’d keep the scope personal. It works because it’s shaped around how I actually buy, keep, and sell things.